From system health to individual requests

Monitor performance trends with metrics and drill into traces for detailed root-cause analysis.

Monitor system health, track performance trends, and trace requests across services-all in one unified observability platform.

From Signals to Root Cause

Metrics and traces work together to show both system behavior and request-level detail.

  • Connect high-level performance trends with individual request traces.

  • Quickly move from abnormal metrics to the exact service or dependency causing issues.

  • Eliminate blind spots in distributed and microservices architectures.

Built to Scale with Your Workloads

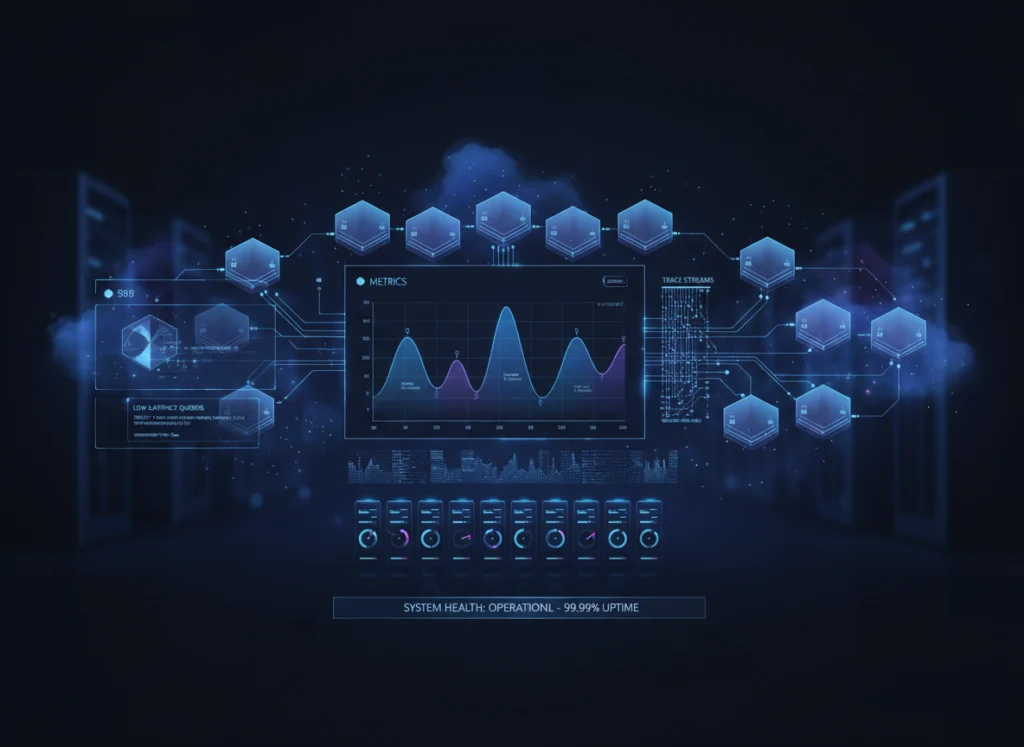
Modulis is powered by a distributed analytics foundation optimized for high-cardinality telemetry data.

  • Scales horizontally to handle high-volume metrics and traces.

  • Designed for low-latency queries across time-series and trace data.

  • Maintains consistent performance under production-scale workloads

Metrics Monitoring

Get continuous visibility into infrastructure and application performance.

  • Monitor CPU, memory, latency, throughput, and error rates.

  • High-resolution time-series data for accurate trend analysis.

  • Custom dashboards for teams, services, and environments.

Request-Level Tracing

Follow every request as it moves through your system.

  • Visualize end-to-end request flows across services.

  • Identify slow spans, failed dependencies, and bottlenecks.

  • Drill down into individual traces for deep troubleshooting.

Proactive Alerting

Stay ahead of performance issues before users are impacted.

  • Create alerts based on metrics and trace-based conditions.

  • Get notified when performance degrades or anomalies appear.

  • Reduce alert fatigue with precise, actionable signals.

Ready to ship like never before?