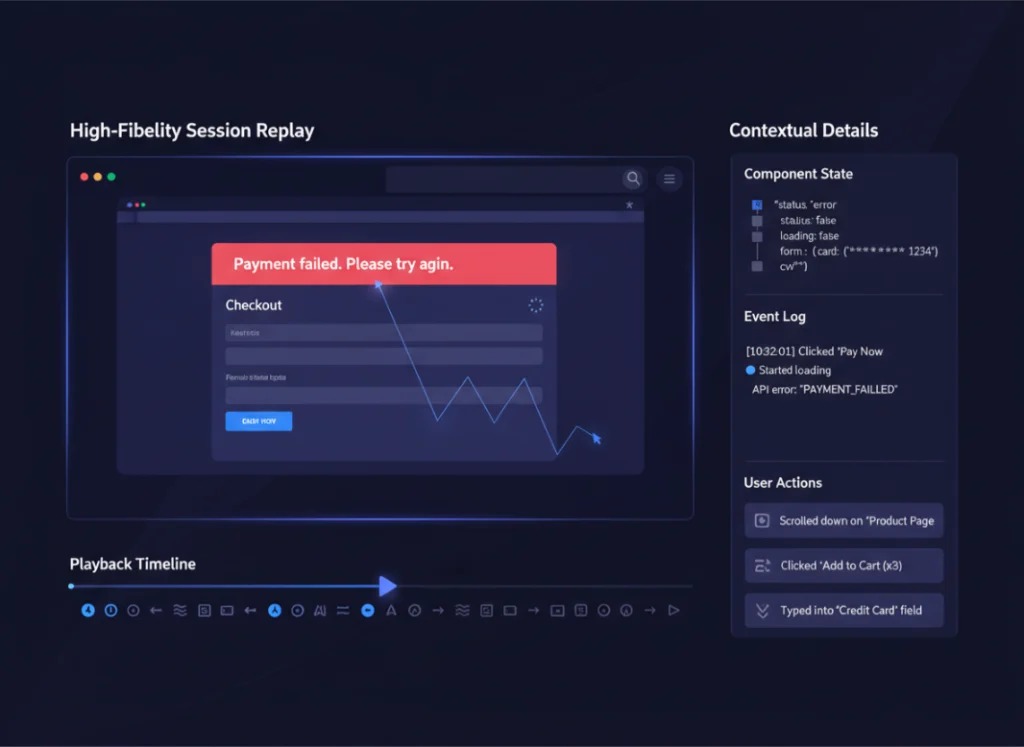
The Svelte.js
monitoring toolkit
you’ve been waiting
for.

What if catching and understanding errors in your Svelte.js app was as easy as deploying it?
With real-time error tracking, contextual debugging, session replay, and LLM-powered insights, Modulis has you covered.

Session Replay

Investigate hard-to-crack bugs by playing through issues in a youtube-like UI. With access to requests, console logs and more!
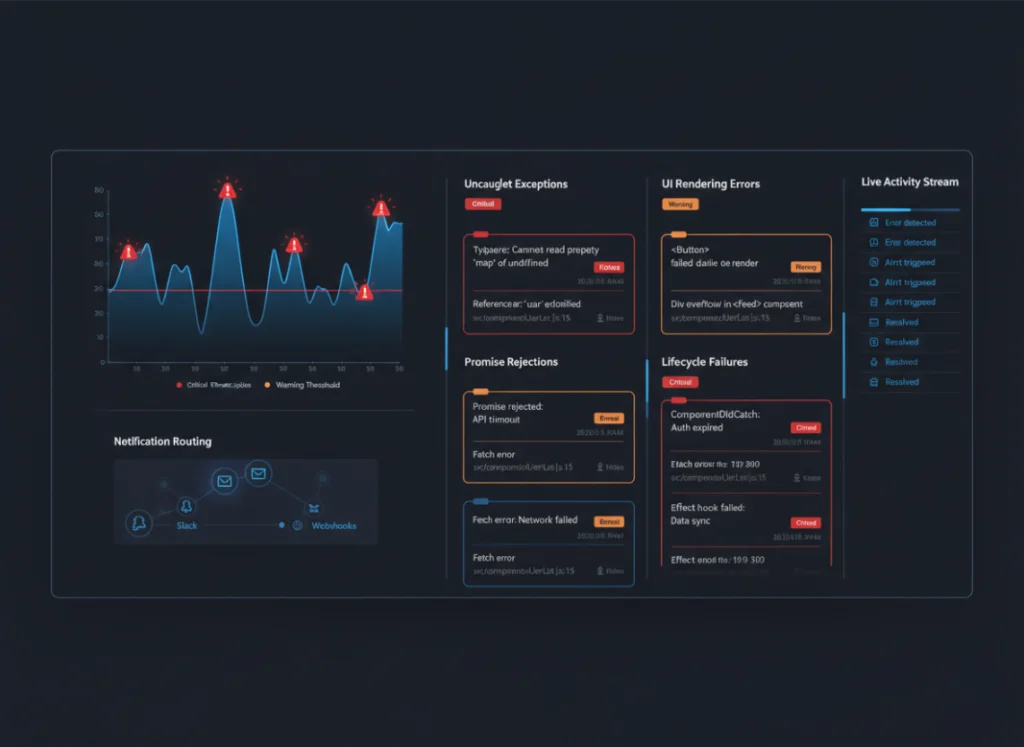
Error Monitoring

Continuously monitor errors and exceptions in your Svelte.js application, all the way from your frontend to your backend.
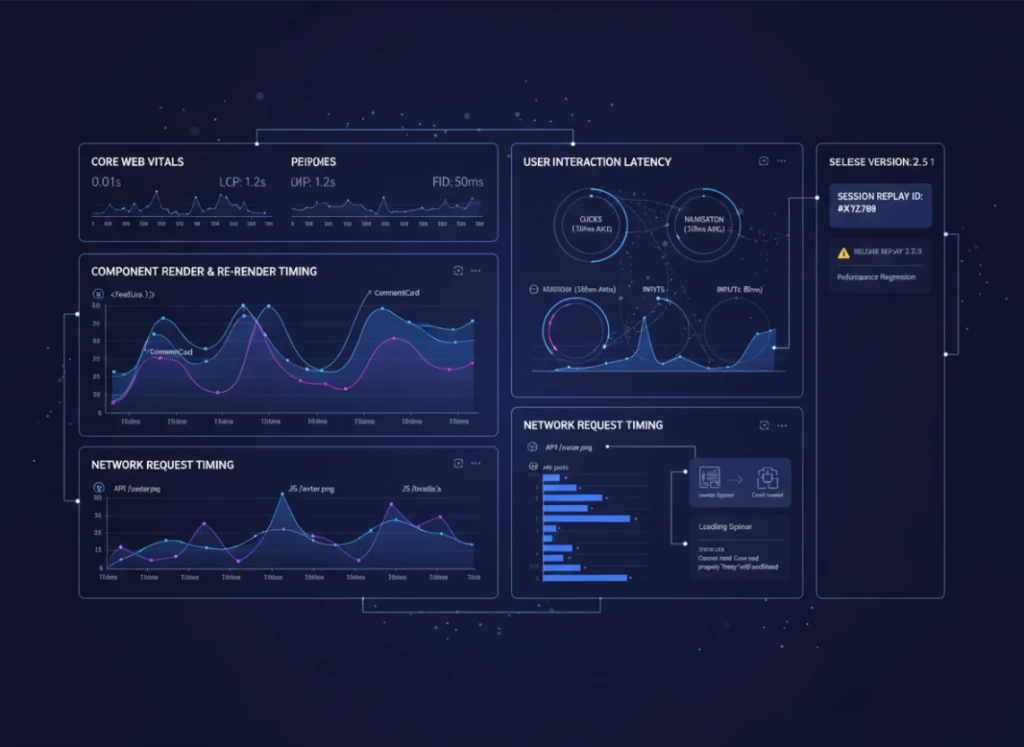
Performance Metrics

Monitor and set alerts for important performance metrics in Svelte.js like Web Vitals, Request latency, and much more!
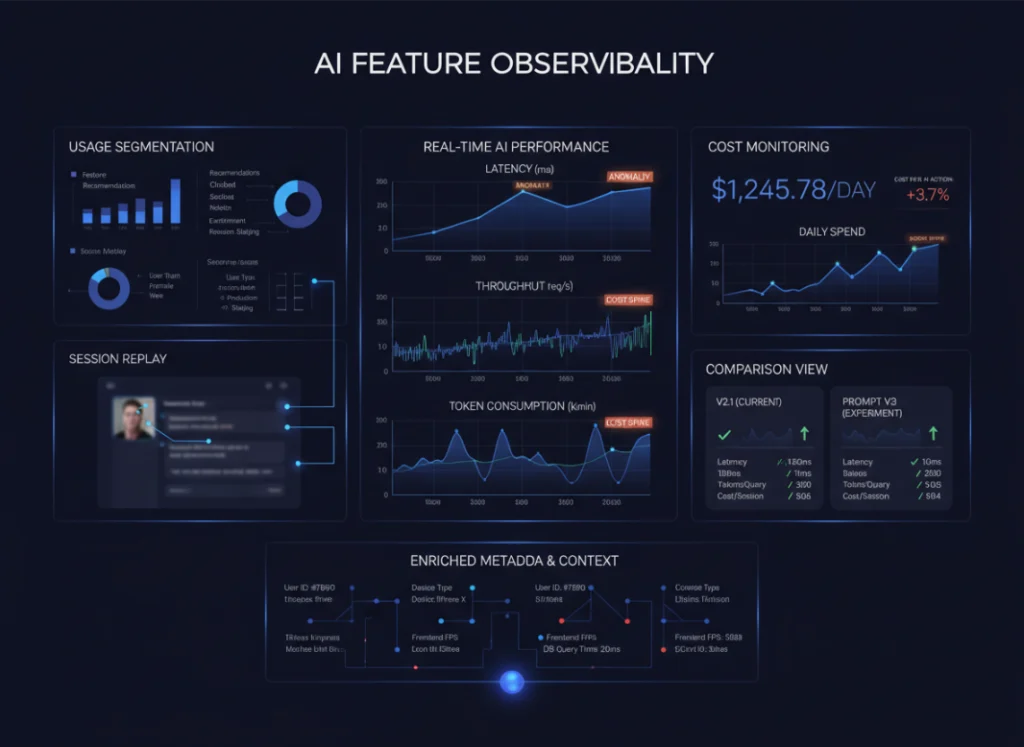
LLM ANALYTICS

If your application uses AI for chat, search, recommendations, or copilots, Modulis helps you understand how those AI features behave in production.

Modulis for Svelte.js

Get started in your
Svelte.js app
today.

				
					... %svelte.head%

<script src="https://cdn.jsdelivr.net/npm/modulis.run@latest"></script>
<script>
	window.H.init('<YOUR_PROJECT_ID>')
</script>

...


Reproduce issues with high-fidelity session replay.

When an error happens, you shouldn’t be guessing what the user experienced.

With Modulis session replay for Svelte.js:

  • Replay affected user interactions from start to finish

  • See clicks, navigation, input, and UI state leading up to an error

  • Understand context instantly without logs-only debugging

Know exactly when exceptions happen

Modulis captures and categorizes Svelte.js errors in real time:

  • Uncaught exceptions

  • UI rendering errors

  • Promise rejections

  • Lifecycle failures

Get notifications when errors hit thresholds that matter, routed to Slack, email, or webhooks.

Monitor the Svelte.js metrics that matter

Modulis captures the performance signals that directly impact how users experience your Svelte.js app—so teams can optimize what matters, not chase vanity numbers.

Track key client-side metrics such as:

  • Render & re-render timing to identify unnecessary component updates

  • User interaction latency across clicks, navigation, and inputs

  • Network request timing tied to UI state and user actions

  • Core Web Vitals (LCP, FID, CLS) mapped to real sessions

All metrics are automatically correlated with errors, session replays, and releases—so performance regressions never live in isolation.

AI performance, usage, and cost—clearly tracked

With the Modulis SDK, teams gain visibility into AI usage, performance, and cost—inside real user sessions.

With Modulis LLM Analytics, you can:

  • Track usage by feature, user, or session

  • Measure latency and throughput

  • Monitor token consumption and cost trends

  • View AI interactions via session replay

  • Compare behavior across releases or prompts

Because LLM Analytics connects to frontend metrics and sessions, every interaction includes user context—making optimization simpler as you scale.

Ready to ship like never before?